Upload video + speaker order of conference sessions
Visual reports
G-app comprises the processing of two sets of data: a visualization engine and a topic modeling algorithm.
The (anonymised) delegate information and transcripts, from formal speeches, as well as chamber discussions, are processed and matched to topics at the conference, generated by the algorithm.
The topic matching component provides oversight of the breadth and specifics of voice and influence, rather than just crude time allocation.
→ The speaker/topic insight is crucial for decision-making. For example, if women are speaking about gender violence, but do not have a voice when food poverty, climate change or finance are on the agenda.
→ Topics: Determined by conference organizers from their official agenda, fed into our algorithm.
→ Video/Audio Recording: downloaded proceedings per session.
→ Speaker Order: Per session keyed to anonymized Conference Demographics.
Reports
G-app then automatically produces graphic reports on:
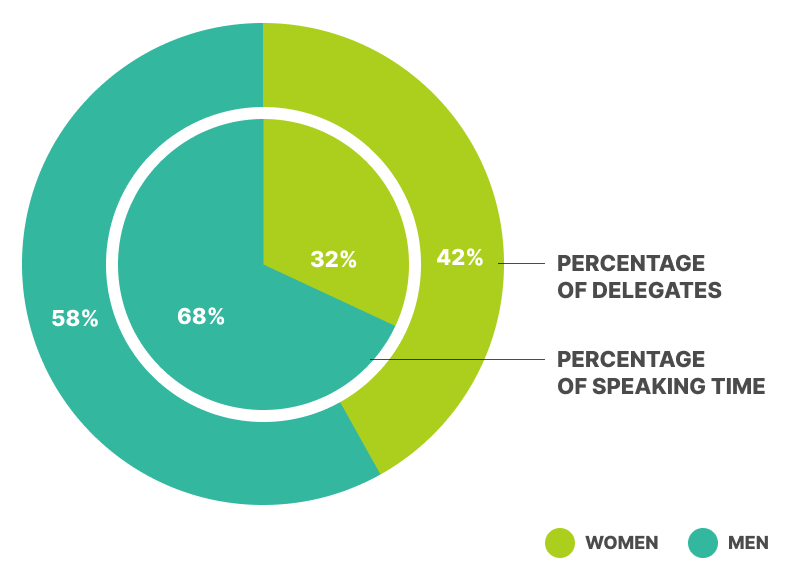
→ Gender Distribution: Percentage of women (and youth if conference is tracking) who registered to the conference in proportion to how much time they spoke at the conference.
→ Gender (and Youth) Representation by Region: Broken down by the 5 UN Regions + Total Average.
→ Gender (and Youth) Distribution by Conference Roles: Head of Delegation, Delegation, Non-Voting Member.
→ Gender (and Youth) Distribution by Session Roles: Chair/Moderator, Keynote/Panelist, Participant.
→Speaking Time by Age (if being tracked): Self selected by registrants, <25, 25-35, 35-45.45-55,55-65, >65
→ Speaking Time by Topic: Always with one bar defaulting to Gender, the g-app explainable algorithm uses Topic Modeling to determine who is speaking about which topics.
Results:
This data enables g-app to analyze and graphically represent data on the representation, active participation, and influence of women, youth and regions.
It effectively measures: Who is at the assembly? Do they have the power to speak? Or do they speak only on certain topics directly related to their demographics?